What is OS Hardening and How Can Developers Implement it
As cyber threats become increasingly advanced and complex, organizations are forced to adopt a military attitude of ‘war footing’ to secure their systems and servers. Although
Ever wonder what lurks in your code that static analysis can’t find? That’s where Dynamic Code Analysis (DCA) comes into play. Unlike static analysis, which inspects code without running it, DCA examines software during execution.
For developers, DCA is invaluable because it provides real-time insights into how your code operates under actual conditions. A recent study found that over 80% of cyberattacks target vulnerabilities at the application layer, highlighting the importance of thorough runtime analysis to catch issues that could lead to serious security breaches or system failures.
By using DCA, you enhance your code’s reliability and gain peace of mind knowing your software is robust and secure.
Dynamic Code Analysis (DCA) involves running your software to observe its real-time behavior, helping you catch issues that static analysis might miss.
While static analysis reviews the code without executing it, DCA tests it in a live runtime environment. The approach allows you to identify problems that only appear during execution, such as memory leaks, concurrency issues, and performance bottlenecks.
DCA offers real-time, context-aware configuration management specifically engineered to accommodate the dynamic nature of contemporary software development. This means your configurations are always optimized and ahead of potential issues. Understanding IAM PassRole setup can streamline your configuration processes.
By integrating directly with your CI/CD pipelines, DCA spots configuration errors right when they happen. Early detection minimizes the risk of deployment issues and saves you time on debugging. DCA’s adaptability to various configuration formats and environments makes it a versatile choice for any tech stack.
Beyond flagging issues, DCA also offers specific, practical recommendations for your setup. Doing so helps you quickly resolve problems and fine-tune performance without sifting through generic advice. Incorporating no-code security automation can further enhance your security practices and streamline your development process.
When selecting a DCA tool, look for these key features:
Here’s a curated list of the top 9 DCA tools across the top 5 software development languages, including commercial and open-source options.
SpectralOps boosts security in DevOps with automated secret scanning to catch sensitive data leaks, dynamic code analysis (DCA) for runtime checks, and policy enforcement to maintain security standards. It helps prevent data loss and offers robust risk and remediation management. Detailed reports and analytics offer a clear view of your security status, helping you comply with regulations.
Integrating advanced security in DevOps workflows.
Free and Premium versions are available.
“One of the reasons we picked Spectral over the other products is Spectral has low false-positive results, which give us a high confidence factor and save us precious development time.”

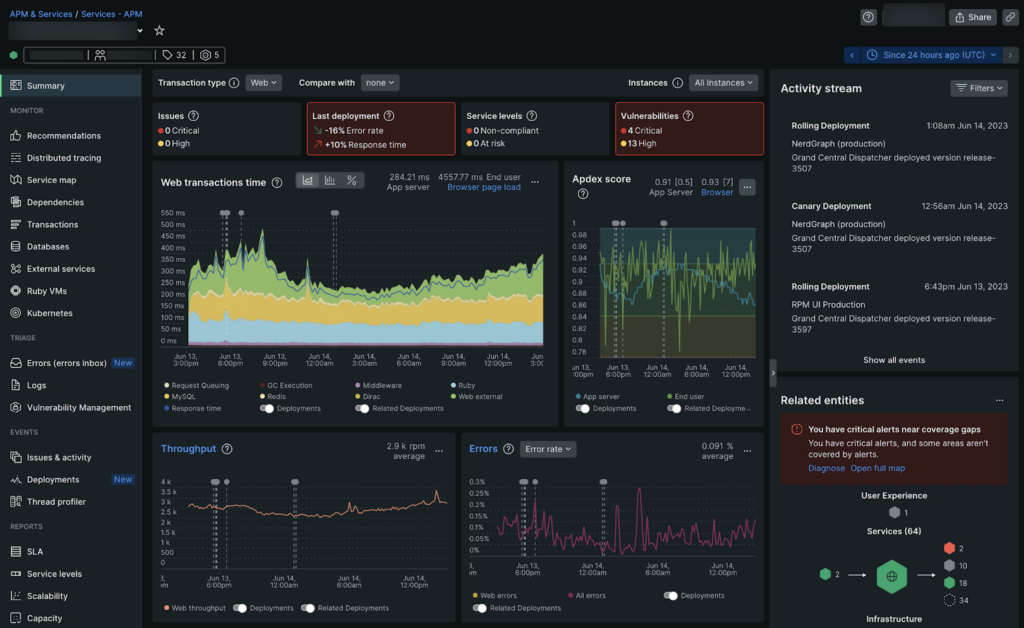
New Relic APM allows you to gather custom data through API calls and user-friendly interfaces. The platform includes both real-user and synthetic monitoring, giving you a complete picture of how frontend and backend systems are performing. New Relic uses AI insights to prioritize the most critical issues and also natively provides insights into runtime performance and potential security threats.
Unifying application monitoring with actionable analytics.
Subscription-based.
“I like how easy the tool is to use and who it gives us quick insights to core problems wherever they occur. It helps our developers see their code performing in real time and it gives them spot on analyses where errors and bottlenecks are found.”
AppDynamics gives you a clear view of your application’s performance – pinpointing slow transactions and unusual activity with real-time monitoring and machine learning-powered anomaly detection. With Deep Code Insights (DCI), you get live visibility into your code during runtime without changing the source code or impacting performance, allowing you to address issues without disrupting your users.
Detailed performance monitoring and insights into user experience.
Subscription-based.
“The interface is straightforward and easy to use, gives total visibility into application performance (Application Monitoring), database performance, and infrastructure performance from one day to one year, and delivers a wealth of information that can be utilized to swiftly remedy a problem.”
Parasoft makes test automation easy for your C, C++, or Java projects. It offers static analysis, unit testing, and code coverage to catch issues early, along with runtime and security testing for deeper insights. With detailed reports and analytics, Parasoft integrates seamlessly with IDEs and fits smoothly into your CI/CD pipelines. For organizations needing to adhere to specific standards, understanding how to comply with PCI DSS requirements can be beneficial when used in conjunction with Parasoft.
Testing and compliance for safety-critical software.
Varies based on usage.
Parasoft C/C++Test includes all the tooling needed to build safe and reliable software. The best feature is integrating unit testing alongside static analysis and compliance checking. If you are building any safety or security-critical software, Parasoft C/C++Test is a no-brainer.
Dynatrace offers full-stack monitoring through its OneAgent technology, capturing detailed data from servers, containers, and more with minimal impact. PurePath provides transaction-level insights, while Smartscape visually maps dependencies across your environment. Dynatrace includes runtime vulnerability analysis to spot security risks in your code and infrastructure powered by the Davis AI engine.
AI-driven monitoring and diagnostics.
Subscription-based.
“It is an easy-to-use, feature-rich monitoring tool with various plugins, the ability to interface with any third-party components, and the ability to design and launch your plugin live. Dynatrace Monitoring’s end-to-end view across the full stack offers faster resolution and more visibility.”

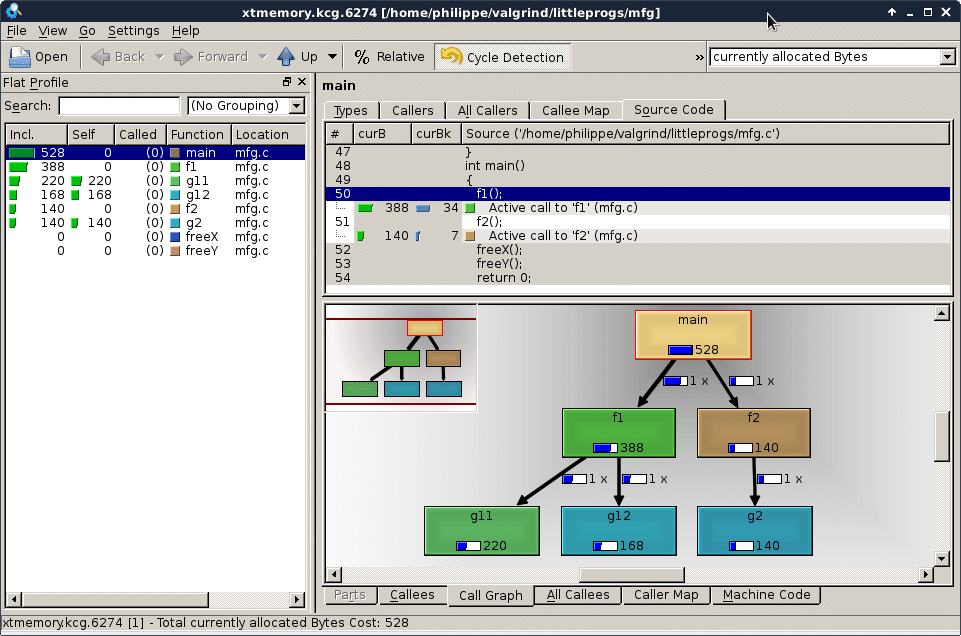
Valgrind is a handy toolset for debugging and profiling your Linux programs. With tools like Memcheck, Callgrind, and Helgrind, you can tackle specific problems like memory errors, cache optimization, and thread synchronization. Valgrind works with your binaries directly, so you don’t need the source code, making it easy to fit into your workflow.
Developers seeking a robust open-source solution for Linux.
Free.
“I think one reason we liked Valgrind best was the easy setup/ramp up process. This made understanding the program painless. Another plus was the memory leak detection. We found this tool to be fairly accurate and informative giving my team and me confidence in the results.”
Pin is a dynamic binary instrumentation tool that’s flexible enough to help you spot performance bottlenecks, memory leaks, and concurrency issues. You can insert custom tools into your programs, making it great for profiling and debugging. There’s no need to recompile your code, and it supports various architectures, making it versatile for different projects.
Customizable analysis needs.
Free.

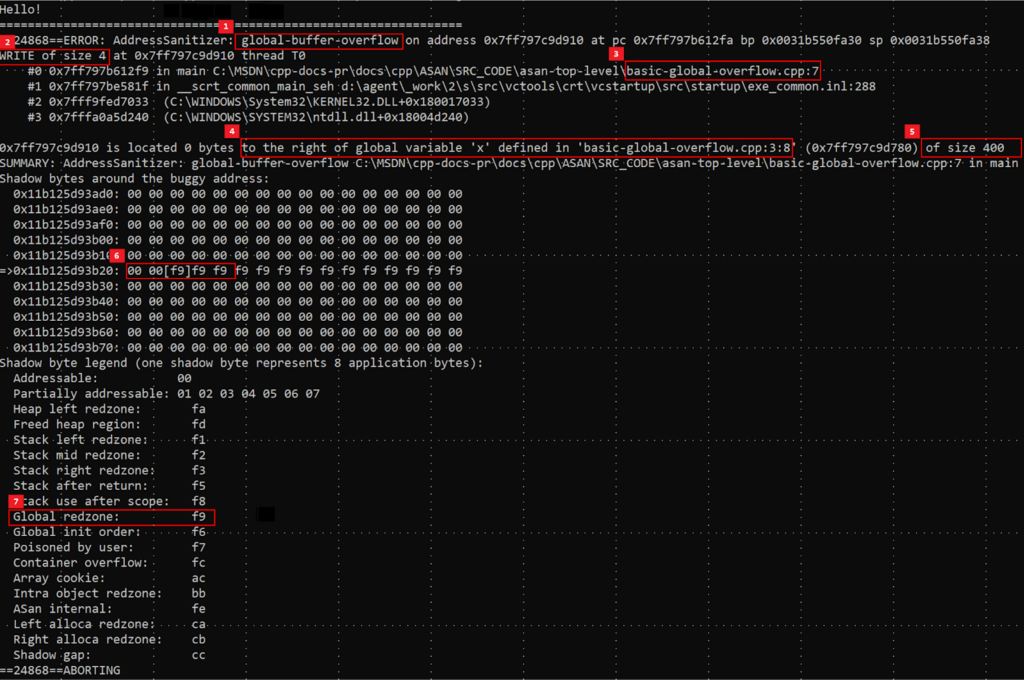
AddressSanitizer (ASan) is a handy tool for catching memory errors like buffer overflows, use-after-free issues, and memory leaks. It’s efficient enough for everyday use, adding checks to your code during compile-time to spot these problems. ASan provides detailed reports pinpointing the error’s location and type. It works with many compilers and supports both C and C++ programs.
Memory error detection in C/C++.
Free.
ThreadSanitizer (TSan) helps you find threading bugs in C and C++ programs, like data races, deadlocks, and sync issues. It compiles your code to track memory access and spot conflicts between threads. TSan provides precise diagnostics, showing exactly where the problem is in your code.
Detecting concurrency issues.
Free.
Dynamic code analysis is crucial for detecting hidden runtime issues and optimizing your code’s performance. From small teams to large enterprises, there’s a DCA tool suited to your needs. Integrating these tools into your workflow can improve your application’s reliability, performance, and security.
SpectralOps offers real-time security analysis by scanning your code and configurations for vulnerabilities, such as exposed API keys, runtime injection attacks, and security misconfigurations. It’s quick to set up and integrates easily into your CI/CD pipeline, making it simple to protect sensitive information and prevent data leaks.
Want to secure your code and protect your company from costly errors? Explore how SpectralOps can help.

As cyber threats become increasingly advanced and complex, organizations are forced to adopt a military attitude of ‘war footing’ to secure their systems and servers. Although

Modern companies are rapidly adopting cloud applications and services due to scalability, cost savings, and faster time to market. DevOps teams and developers must deliver fast,

DevOps teams are one of the most essential links in the software development chain. It seems like they have a hand in everything that takes place