Top 9 Vendor Risk Management Software for Infosec Pros in 2023
No single organization can master all trades, which is why their success hinges heavily on their vendors. And if vendors are crucial for your business operations,
Nobody loves a bug in their code. They’re annoying and create bumps in our flow state when coding. Yet, they feature on a frequent basis when we code. This is where debuggers come in.
A bug is when a flaw in logic is coded, or an implementation is flawed. A debugger is a software development tool that helps us hunt down where we went wrong in the code. Then we can begin to unravel the mistake.
Very early on in our careers as developers, we start using debuggers to help us fix our logical flaws faster. But not all debuggers do the same thing. Here are the 11 debuggers in 2021 that you should know about.
The major perk of GBD is that it allows for remote debugging. For example, you might be running an orchestration of servers and one of them blips out. You don’t know why and you need to take a look inside. GBD allows you to run the debugger on your machine against the program that’s running on the remote machine. The debugging tools include the ability to place breakpoints for inspection, step through processes and observe variables.
The GDB doesn’t have a graphical user interface. While this may seem foreign when compared to more modern debuggers, GDB runs in the command line – a native space for many developers working on the server-side and backend projects, which is aligned with the languages the GNU Debugger supports.
Lightrun is a server-side debugger that lets you run tests and diagnostics against your microservices, Kubernetes, Docker swarms, and Amazon web services.
What makes Lightrun different is that debugging can happen in real-time and right on the service while it’s running. There’s no need to try and replicate or create mirror servers in order to solve the problem. There is also no downtime to deploy Lightrun, helping preserve the bug or issue in its original form.
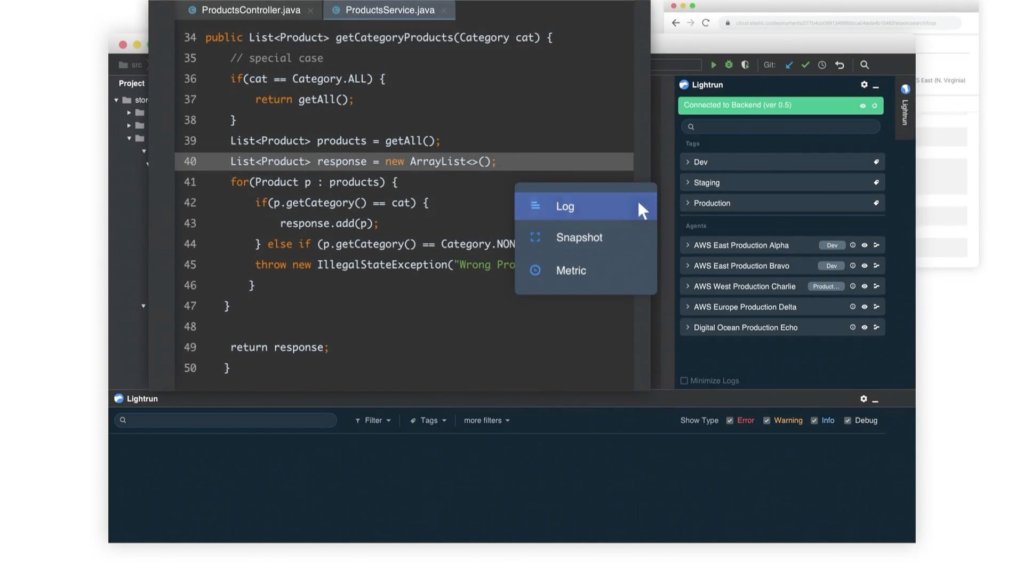
This is beneficial to developers because it saves us time by giving us the information we need as we need it without interrupting our services. The debugging tools that Lightrun offers include the ability to add log lines, metrics, and snapshots from your IDE. When you have Lightrun, you can debug your live server without interrupting it.
Fusion Reactor is a continuous monitoring, profiling, live debugging, and multi-channel alert integration tool. It that offers a full suite of features that can help you hunt down your bugs, leaks, and spikes faster and easier.
Live debugging makes it easier to see code stacks as it executes, which can come in handy for tracking and tracing logs in real-time. Often, when debugging, we’re forced to halt the code in order to dissect what is happening. Depending on how it’s done, this can distort the outcome and help the bug evade us.
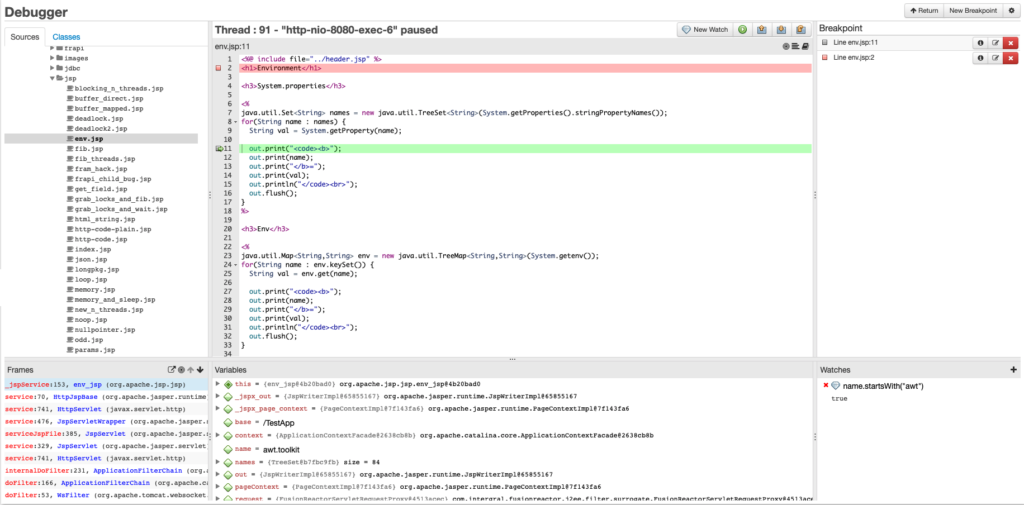
Fusion Reactor’s error pointing is specifically designed for Java and ColdFusion, and non-blocking breakpoints can be set against the code for a complete stack trace report. This means that you can monitor, watch, track and trace without interrupting server processes. If you have distributed systems or run on a microservice architecture, the ability to debug without interruptions can be vital to finding the source of the issue.
Interactive Disassembler, or IDA, is a piece of software that allows you to reverse engineer machine-executable code back into assembly language source code. This can be useful for debugging programs that have already been compiled and may not have direct access to the source code.
IDA Pro is the commercial version of Interactive Disassembler and contains all the latest features and functionalities currently available. Older versions are available for free.
What IDA does is allow you to cross-reference code sections, track parameters and API calls without having to constantly go through the compilation process. Rather, you get access to sections of data and have the ability to rename, annotate and add information to parts of the code without the need to reboot it every time you want to add a log.
Ghidra is a free tool originally created by the NSA and allows you to reverse engineer software back into its original source code. It’s a full-featured SRE framework with code mining capabilities.
This is a special tool because it can help you track, trace and patch up vulnerabilities against malicious code and malware that may have found its way into your systems.
Ghidra is not your typical debugging tool. It can be used as a source tracking tool through acts of disassembly, assembly, decompilation, graphing, and scripting.
Valgrind is a debugging tool that targets memory management and allows for your software to be profiled at a software and hardware level.
It tracks how your software is consuming and utilizing the hardware, helping you detect and fix memory leaks faster. It can come in the form of memory assignment tracking, stray uninitialized values, mismatched frees, heap blocks, and overlapping source and destination memory blocks.
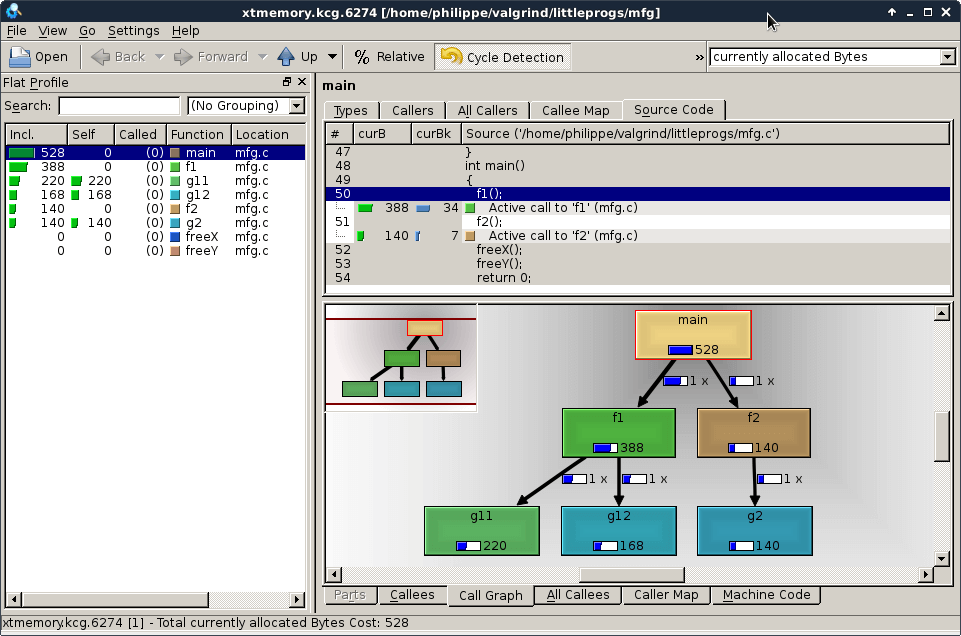
The perk of Valgrind is that it is open-source software, meaning that it is free to use and implement into production servers. It supports a range of Linux based platforms and a side of Android for mobile hardware debugging.
PurifyPlus is a run-time analysis tool. What this means is that it tracks the system during run-time and watches the CPU allocations and any other potential bottlenecks in the application.
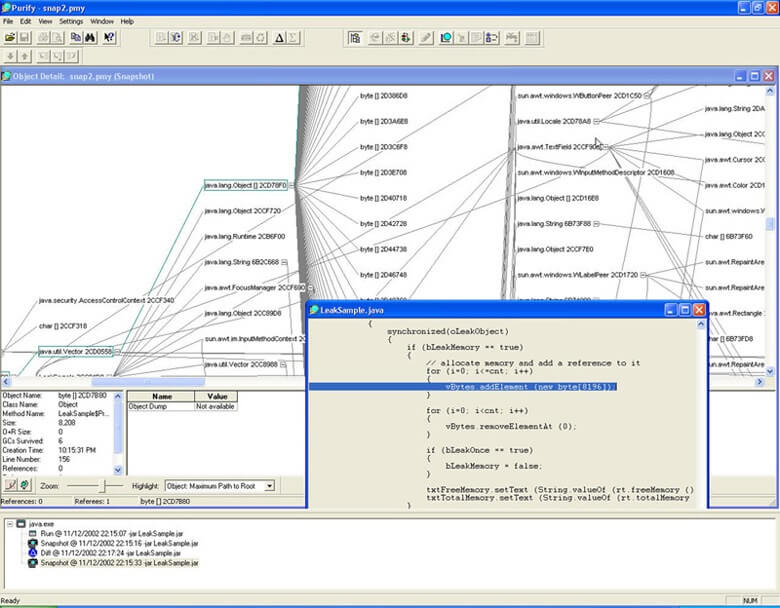
So how does debugging work with PurifyPlus? Because this is a run-time debugger, you’ll get to see the issue as it occurs rather than try to replicate and debug after the error has occurred. This means you can leave PurifyPlus on your server to track your systems and give you analytical insights when you need them.
LLDB debugger is the default debugger on XCode for macOS and supports C, Objective-C, and C++ for desktop and iOS devices. This debugger also has extensions that enable it to be python scriptable. If you’re already familiar with GBD, the command syntax is structurally similar and what you already know can be transferred over.
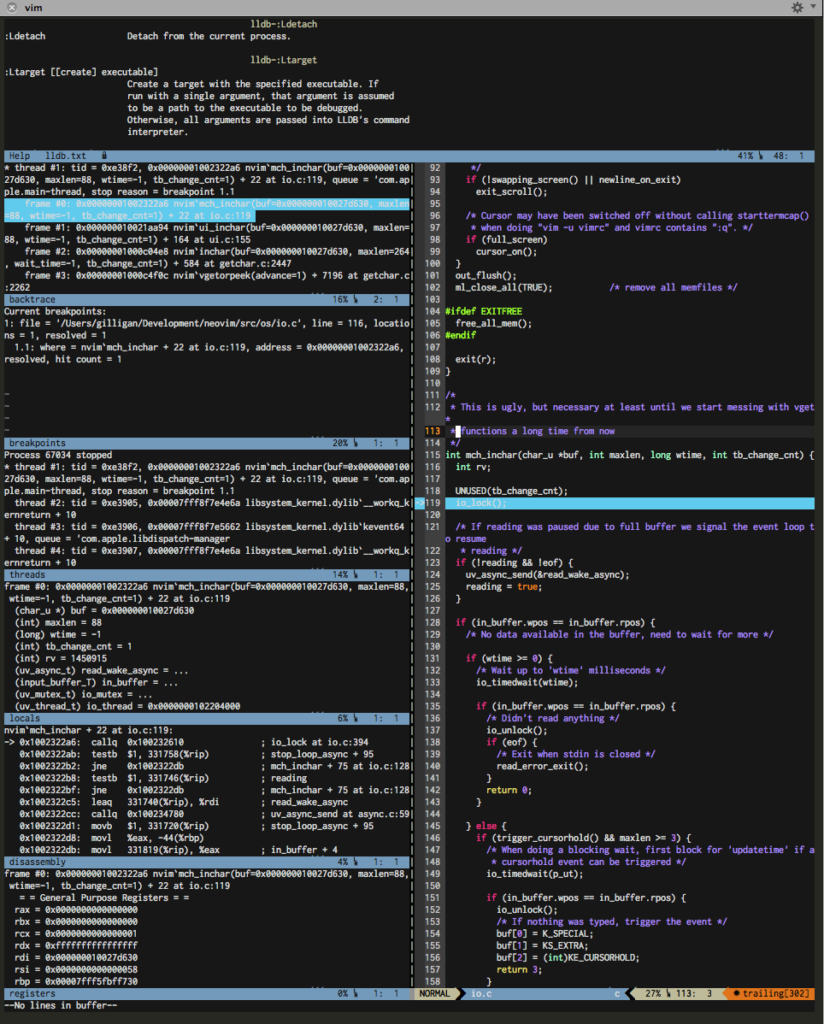
LLDB is integrated into the compiler and allows for breakpoints to be inserted, comes with an in-built command-line tool, allows for remote debugging, and has a disassembly functionality. This allows you to debug your code without the need to recompile each time you run your software. You can use the data logs as part of your debugging analysis without it impacting your hardware because it is highly efficient with memory use.
Affinic Debugger has the same expected features and functionalities of debuggers – breakpoints, insertion tools, and disassembly. However, what makes Affinic Debugger stand out is that it is designed to work with an interface. This means that if you’re not used to debugging via console, Affinic Debugger offers a UI friendly alternative.
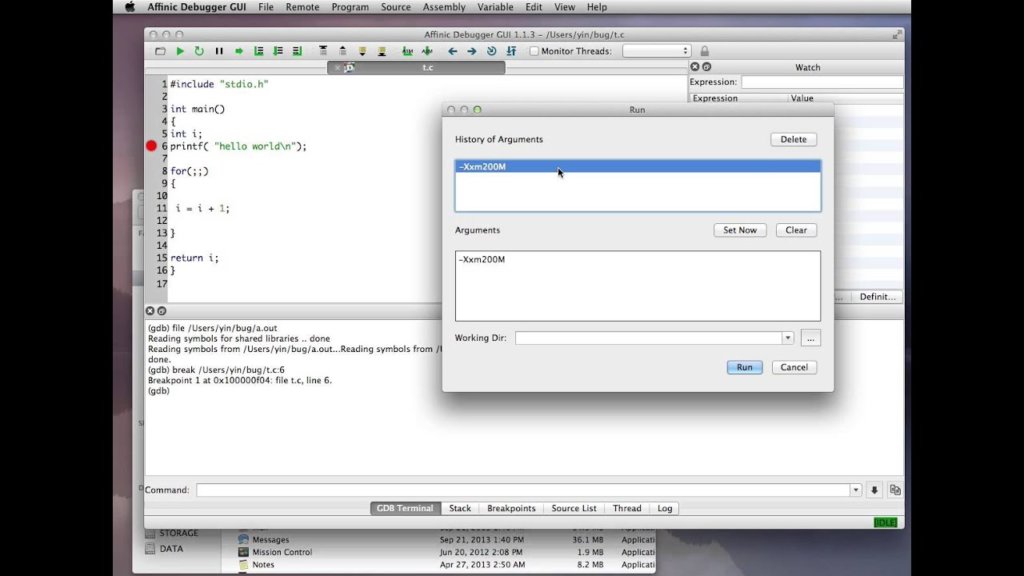
What this means is that you can access debugging operations for a toolbar rather than trying to figure out the right commands in a console. The graphical interface lets you trace your code and provide memory-based historical data with breakpoints and commands.
In addition to this, Affinic Debugger can also sit on top of GDB and LLDB. This means you can run both in conjunction to provide a more detailed log of what’s happening behind the scenes of your applications.
Sentry is a monitoring platform that lets you track the performance of your code over time.
It sits in the background and polls your software diagnostics, allowing you to keep logs for referencing back to if something does go wrong.
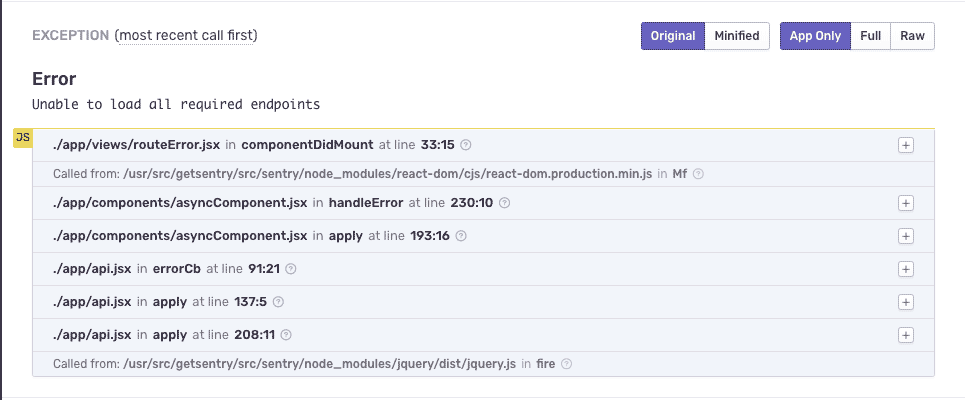
Sentry allows for stack tracing and its monitoring capabilities aren’t just limited to the backend. You can deploy Sentry to any layer of your application – frontend, backend, and distributed servers. It’ll do the automatic logging with breadcrumb events that let you trace down the issues and how they came to be. Errors can also be traced back to versions released, allowing you to figure out if a change is the root issue.
SmartBear AQTime Pro is software that sits inside your Visual Studio IDE and acts as an enhanced debugging tool that lets you follow your app from compilation to run-time.
The major difference between AQTime Pro and the other debuggers mentioned here is that it is designed to work with Visual Studio. This means that the debugging tools and controls are intuitive to the user. It covers all major languages including C and C++, .NET, and Delphi. AQTime Pro is also more graphically interactive than most debuggers.
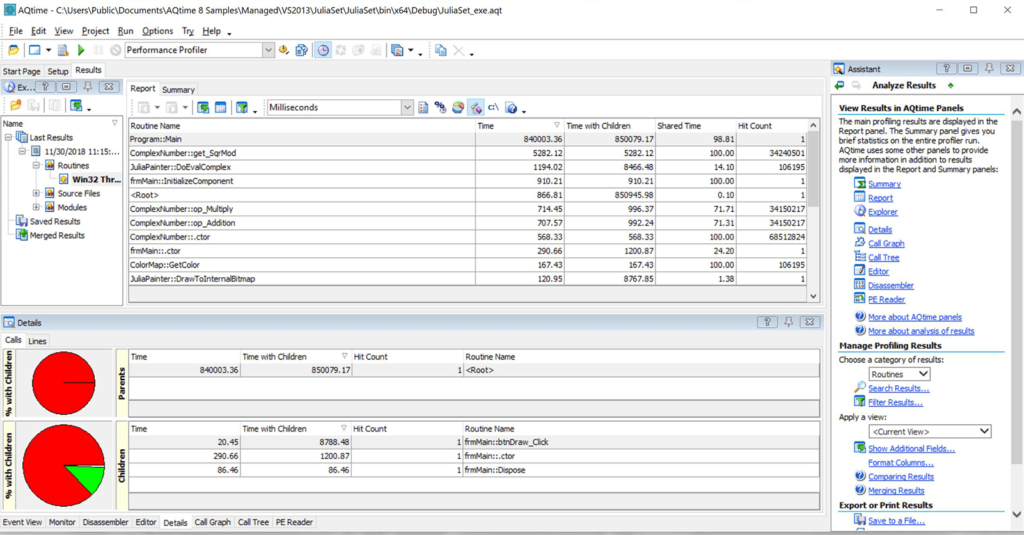
It also comes equipped with the ability to export logs and profile runs into various formats such as Excel, HTML, XML, or text files.
Debuggers are a necessity when it comes to figuring out what went wrong. Most of the time, when bugs happen in production, it’s because a resource is not being used as effectively or efficiently as it could be.
Odds are you can avoid at least some of those by using one or more of the debugging tools listed.
No single organization can master all trades, which is why their success hinges heavily on their vendors. And if vendors are crucial for your business operations,
Integration is an indispensable aspect of modern software development. As software applications become more complex and interconnected, every component must work seamlessly together like a game
Modern companies are rapidly adopting cloud applications and services due to scalability, cost savings, and faster time to market. DevOps teams and developers must deliver fast,