Top 10 CI/CD Automation Tools
Software teams have focused on agility since the world embraced Mark Zuckerberg’s motto to “move fast and break things.” But many still lack the confidence or
The lifecycle of machine learning apps is a known phenomenon in the AI world; Product team defines a need -> ML team generates a model -> Offline KPIs look supreme -> Deployment to production -> No usage -> Zombie app was born.
But this is not a prophecy. There is much we can do to make sure apps will be valuable. The last mile of user nurturing is where too many data scientists fail to make sure their app is applicable. Here are five steps to avoid it.
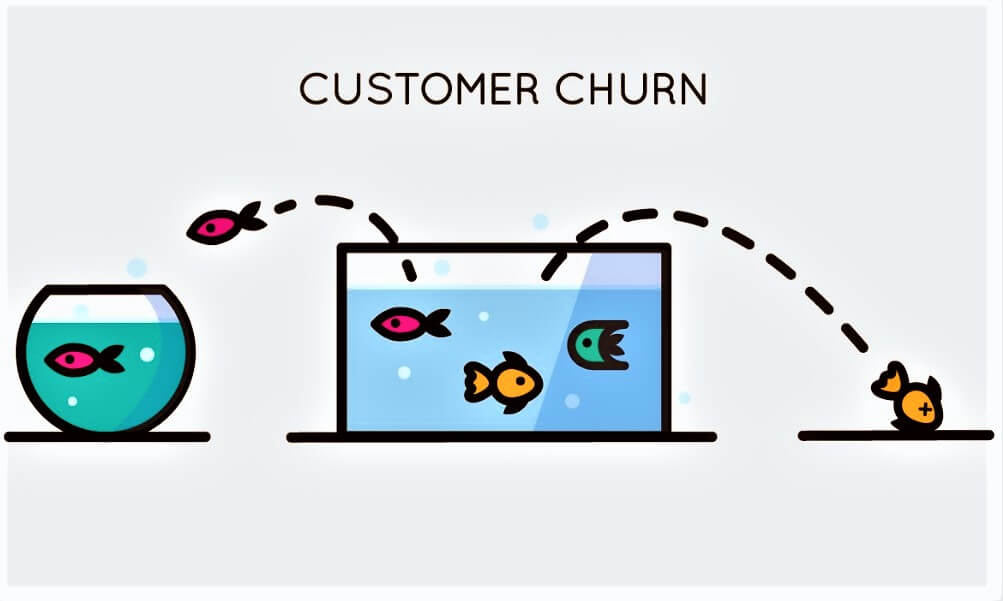
Churn is a common headache for most businesses. One of the biggest questions often asked around the C-suite table is: How can we make sure our customers don’t leave? Churn affects margins and customer lifetime value so every company in the world wants to prevent it.
Let’s assume our task is to alert when customers are at risk of churn one month in advance. Following that need, we collected diverse datasets and trained a model that shows a 90% prediction accuracy on the validation set. Proudly we forward our app to the customer care team, but soon we notice it has almost no usage. What went wrong?
Usage is probably the number one indicator in predicting churn – customers paying for a service without using it are likely to churn. This is why usage is one of the first features to add to the model input.
Later on, trying to understand the model predictions and their structure, we discover that usage becomes a binary feature: the customer is either using the service or (nearly) not. This is bad since, during online inference, we will notify only of customers who are about to churn (having no usage) when it’s most likely too late at that phase.
The root cause is the difference between offline analysis (when the whole picture is available) and online analysis (when the state dynamically changes), leading the model to favor strong indicators such as ‘no usage.’
How can we fix this? A simple solution can be to ‘blur’ the raw usage values, lower the likelihood of the model, overfit it, and make the model pay more attention to the other features in use.
A more fundamental solution would be to update the label indicator from looking at churn point to decision point; as the real question we’re trying to answer is how to prevent churn (VS who will churn), we should predict when customers decide to churn (when it’s still preventable) not when the real churn happens (and we have nothing to do to stop it). The issue is this is a more complicated task – how to identify that point? Possible simplification could be to use the date X days before the churn date. The question would be how to choose that X.
Now that we have predictions, we need to alert when we predict a customer is at risk of churn. There are many UX questions to be considered – starting from how to UI it.
The naïve approach will be to use the prediction label, churn VS not, with optionally added prediction likelihood. But how should you compare 82% to 78% likelihood? A standard solution will be to bucket the likelihood to low/med/high. But what about history? Should we start with new alerts, or maybe long-alerted customers are more important? In general, how to prioritize the alerted accounts?

Assuming you have answered all the above questions, alerts were sent far enough in advance for support to see it on time and they manage to reach the target customer. So what’s next? The real questions to answer are (1) which customers can we save from the churn and (2) how. Without this information, the app users are in the dark.
The solution could be to utilize the prediction reasons to prioritize and suggest what to do. For example, assuming customer A is at risk of churn, a new customer with low usage patterns; means helping to raise usage by supplying a better onboarding experience to mitigate the churn risk. The difference is the addition of what to do given the churn likelihood. Making it an actionable work plan instead of a raw KPIs list.
While it is the exciting ingredient, ML prediction is only part of the context needed to evaluate the alert. Consider the previous example; the signal could be self attained by adding inputs like customer life cycle phase and recent usage levels. In many cases, the users of such apps are nontechnical. So they need to search through various systems to build the whole picture only to process the alert correctly.
If we provide the users with the extra mile needed (whether it’s data from salesforce, zendesk, gainsight, or even slack), it can upgrade the app from ‘nice to have’ to a ‘game changer’ in your users’ tools arsenal.
What are the KPIs of app success? The immediate ones will directly measure its purpose – the number of churned customers should decrease, the satisfaction should increase, etc. While tempting, one should keep in mind that the first impression is the last impression for many. As the app’s success relies on many other factors (like users adoption), we should define more realistic KPIs. KPIs that will take into account the app life cycle phases.

A standard solution can be to measure in-direct indicators of the app’s success. These include offline performance, users usage, alerts relevance, and the number of saved customers. Together they can indicate the app is on the ‘right path’ and buy some time to achieve the direct measurements.
Once you set success KPIs the next step is to add monitoring. What fields should you monitor? Besides the direct (churn rate) and indirect (usage and relevance) ones, validating the users’ app utilization is essential to ensure it receives a fair test. Many user types exist; some are early adopters just waiting to try new stuff, some aren’t, some are just not the best in town. Monitoring users’ actions is essential as it enables direct feedback. To validate the UX assumptions, to observe how users are using the app.
For example, we could notice that users are not consuming the newest alerts first or not paying enough attention to the resolution suggestions—issues that better education can solve. Better app utilization will lead to more usefulness and probably will improve the KPIs we measure as well. More experienced user is more likely to find it helpful.
Churn is just an intuitive example, but the truth is those patterns exist on many AI products, from super simple to the most complicated ones. Paying attention to the last mile will ensure that all the super important work you have done so far does not go to waste. The last note is to try to keep it simple. Validate, gain feedback and improve. Your users will thank you 🙂
Software teams have focused on agility since the world embraced Mark Zuckerberg’s motto to “move fast and break things.” But many still lack the confidence or

Becoming and staying PCI compliant both take a lot of work. Developers are often already swamped with an endless list of tasks, and adding PCI compliance

Security is the biggest threat facing organizations that strive for faster software delivery. Organizations are witnessing increasing attacks due to application code gaps and security weaknesses.